

Excel Makes Your Life Easier

I used to not like Excel.
It’s unclear as to how to start, a whole lot of empty cells that are supposed to become something insightful.
Then you see professionals create these complex colourful monstrosities that are impossible to understand, and you feel even more lost.
Fortunately, it doesn’t need to be this way.
Excel is designed to make your life easier, allowing you to ask good “What If?” questions without lots of complicated work.
If you’ve built a good model in Excel, then a single change in one box will make all the other boxes update instantaneously.
Therefore, if you’re curious about the impact of a price rise or sales increase, you’ll find out what it does to your financials in literally one second.
Before computers, if you changed the price of a latte from $3.80 to $4, you’d have to re-do all your calculations.
Nowadays, you change one number and Excel does the rest.
Better yet, you can click on a number and see where it came from.
If it’s derived from a series of complex calculations, that will be clear.
If it’s a wild guess you pulled out of thin air, that will be clear as well.

Excel is like programming a robot
It will do exactly what you tell it to do, irrespective of what you meant for it to do.
It is very literal – it follows instructions to the letter, and does them instantaneously.
If we’re careful, this will save us a lot of time.
If we cut corners and get sloppy, then we’ll waste a lot of time further down the road.
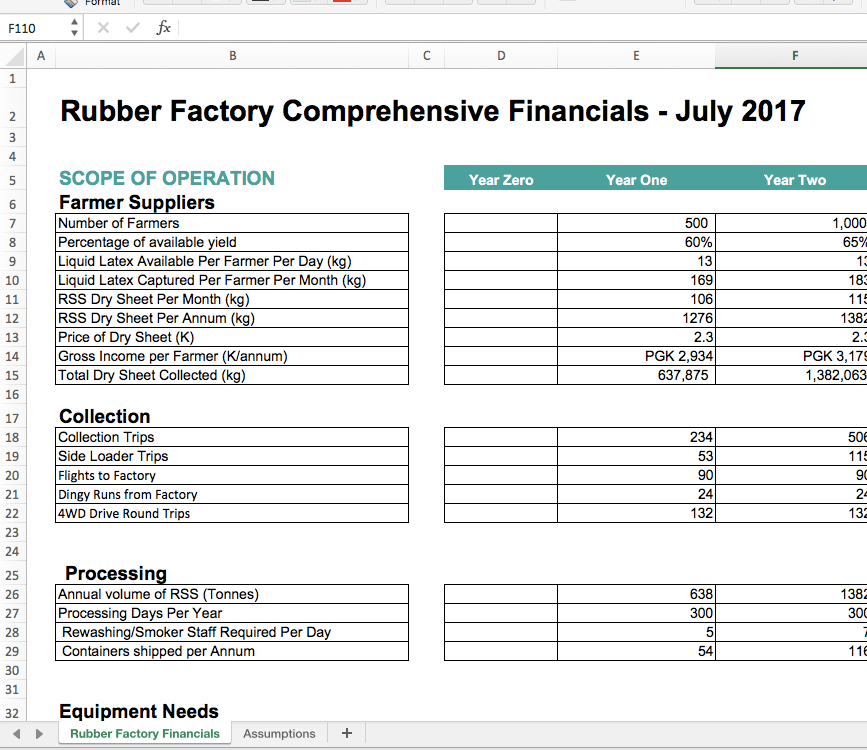
Let’s start with the easiest part: the assumptions table.
This is simply a big list of all the numbers you’re guessing.
For example, it might be the price of each product/service, or the amount you spend on rent each month.
We’re listing three things: the item, the number and the explanation.
This means we can make guesses without forgetting that we made them up.
It also means we can keep track of where each number came from, like a supplier’s quote, past historical costs or an educated guess from a friend.
You can generally list these pretty quickly.
Now we want to build the model itself.
This is the skeleton we’ve been discussing earlier: Revenues – Costs = Profit.
We’ll start by calculating total revenue, then subtract the different types of costs, then tally up our profit (or loss).

Big numbers aren’t impressive if we can’t understand them
For example, having $2,000,000 of revenue sounds like a great number, but if we don’t know how it’s calculated then we can’t be confident that it’s correct.
To find out how much revenue we earn, we need to go back to the basics.
We need to first work out how many days per month/year we’re open, then see how many items we sell each day.
To work out how many items we sell, we need to know how many customers we have, and how many items they typically each buy.
Yes, it’s tricky to work all this out, but the good news is that by doing it properly once, it’s easy to copy and paste these calculations for future years.
To do this, we need to give each cell a job.
This is where we write a clear instruction
e.g. to fetch a number from another cell, to multiply or tally a series of numbers, or to calculate the difference between two figures.
We’ll be telling these cells to take numbers from the assumptions table, then add/subtract/multiply and divide with each other.
e.g. for monthly revenue, we’re multiply “days per month” with “revenue per day”.
The reason we use an instruction instead of typing in a figure is so that it automatically recalculates when something changes.
If our business goes from being open 5 days per week to 6 days per week, we just change it in the assumptions table and all the other cells update accordingly.
We don’t have to go through the whole sheet finding and changing the number “5” to the number “6”, it’s all taken care of in a split-second.
The way to do this is with the "=" sign.
e.g. this cell = (the days per month cell) multiplied by (the revenue per day cell)
This will look like =d6*d11
The internet is full of better guides about how to use formulas, so I won’t attempt to write my own.
The important part is this: By “explaining” to excel how you make money, you make it clearer for any other reader – and yourself.
This forces you to see things clearly; revenues are made up of 2 or 3 factors, and each one can make or break the business.
That can be a stark reminder, one which prompts you to rethink your growth plans – perhaps it’s easier to raise prices or get customers to come back?
It also means that changes to your assumptions (in that table) instantly flow through the whole model, allowing you to see their impact on your surplus.

Visual Decoration
The purpose of your spreadsheet is not to create a work of art.
It’s not about looking impressive or overwhelming your reader with complex information.
The aim is to clearly demonstrate where your money gets made, where it gets spent, and how much should be left over.
I cannot stress this enough: any tricks that reduce clarity are a hindrance.
That goes for fancy colours, charts, formulas, overwhelming amounts of information or unreadable fonts.
They don’t make you look clever, they make you look insecure.
This is not the time to look creative, it’s time to show that you’re profitable.
More importantly, camouflaging your errors is dangerous.
Yes it’s embarrassing at first, but finding an error early can save you a lot of headaches in the future.
Bonus personal pet hate: as if you can predict that you’ll make precisely $34,577.39 in a week.
You don’t need to show two decimal places on your financials, they make the sheet harder to read.
Tabs
Having a few different tabs can be useful – it separates out different pieces of information in a way that makes the whole document readable.
However, using more than 5 tabs is usually a bad idea, for three reasons:
1. It’s difficult for new readers to comprehend
2. It’s annoying to keep clicking in and out of that many tabs
3. It makes it harder to set up formulas
Linked Sheets
Some people like to draw data from other documents;
e.g. “Prices for this spreadsheet are automatically updated from another source”
Get lost.
I’ve never seen this go well.
First of all, it gets messy when one of those sheets updates.
Secondly, it is awful to deal with when you don’t have internet.
Thirdly, your idea should not be so complex that you need this much information.
Unless you’re modelling a billion dollar merger, stick to one document.
Version Control
Everyone has their own feelings about how documents should be named or how versions should be filed.
I personally don’t mind, but I highly recommend updating the version number each time you make changes.
e.g. Happy Valley Coffee Financials v15
or Happy Valley Coffee Financials v16 IJ Edits
That way you only need to change the number at the end, or mention who changed it.
Be careful calling something “vFinal”; it’s never the final one, so you end up with silly names like “Happy Valley Coffee Financials vFinal_FINAL_FINAL(2)”
Also, don’t let someone make changes to your sheets without them telling you what they’ve done.
Otherwise you have them re-write your formulas (deliberately or accidentally) and you’ll be grappling to work out what they did and how to fix it.
The aim with excel is to build something simple – even too simple – and improve it bit-by-bit.
It’s better to have a spreadsheet that works and make it bigger over time, than to try building something ornate and getting lost on the way.
If what you’re building doesn’t make your life easier, it might be time to start again and create something that helps you make good decisions.